
Northern Mexico Irrigation Uses 82% More Water Than Crops Need

A field study published on 11 November 2026 in Discover Sustainability found that farms in one northern Mexico irrigation module applied about 82 percent more water than their crops were estimated to require.
Researchers measured water delivery and crop production across 313 plots covering 1,066.9 hectares in a module of Irrigation District 017 in the Lagunera Region. Average irrigation application efficiency was 54.8 percent. Put another way, the average applied depth was 182 percent of estimated crop need, an excess of 57.8 centimetres.
That calculation is more informative than simply saying efficiency was low. If crop demand is treated as 100 units, farmers applied about 182 units. The study does not show that every extra unit was permanently lost, because some water can remain in the soil or return to the hydrological system. It does show a large mismatch between scheduled delivery and estimated crop requirement at field level.
A large field sample behind the headline
The team assessed cotton, walnut, forage sorghum, broom sorghum, melon and watermelon. Water entering each plot was measured during irrigation events using channel dimensions, flow velocity and irrigation duration. Crop water requirements were estimated with the FAO 56 Penman Monteith method, local weather data and crop coefficients.
The sample represented 57.3 percent of the authorized irrigation area in the selected module. It included 74 cotton plots, 51 walnut plots, 20 forage sorghum plots, three broom sorghum plots, 38 watermelon plots and 127 melon plots. That breadth makes the result more useful than a small station experiment, although it still represents one module rather than all of northern Mexico.
The district itself is economically important. Irrigation District 017 supports more than 90,000 hectares and receives an annual allocation of about 1.024 billion cubic metres, depending on storage in the Lázaro Cárdenas dam. Surface irrigation through open canals remains the dominant system.
The crop that produces the most is not the crop that earns the most
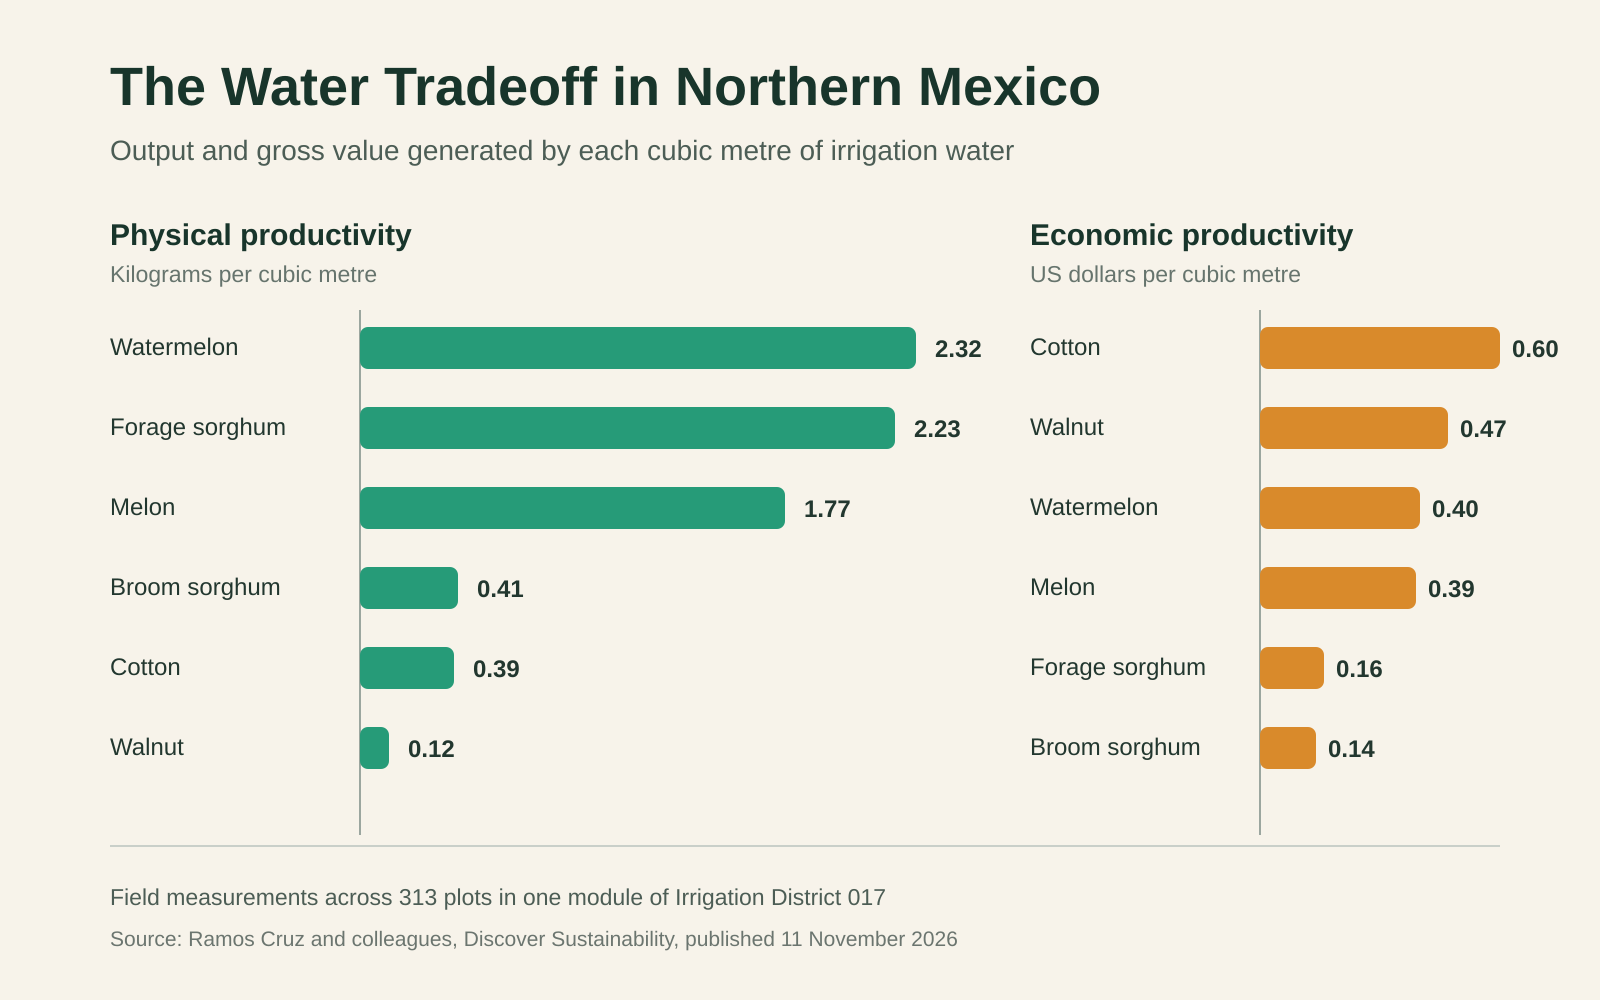
Watermelon generated the highest physical water productivity at 2.32 kilograms per cubic metre, closely followed by forage sorghum at 2.23 kilograms. Melon produced 1.77 kilograms. Cotton, broom sorghum and walnut were much lower at 0.39, 0.41 and 0.12 kilograms per cubic metre.
The economic ranking was almost reversed. Cotton generated about 0.60 US dollars per cubic metre and walnut about 0.47 dollars. Watermelon and melon produced about 0.40 and 0.39 dollars. Forage sorghum and broom sorghum generated only 0.16 and 0.14 dollars.
This is the central planning problem revealed by the study. A crop can turn water into a large amount of biomass while creating relatively little gross value. Another crop can produce less physical output but still earn more because the market value of that output is higher.
Forage sorghum illustrates the conflict. It ranked near the top in kilograms produced per cubic metre but near the bottom in economic return. Cotton ranked near the bottom physically and first economically. Watermelon and melon offered the most balanced profile, combining relatively strong physical productivity with midrange economic productivity.
Why excess irrigation can hurt more than water accounts
Applying more water than a crop needs does not guarantee a larger harvest. The researchers noted that excessive irrigation can contribute to waterlogging, nutrient leaching, poor soil aeration and greater disease pressure. The measured yields for forage sorghum, melon and watermelon were also below reference values previously reported for the district.
The study did not run an intervention that reduced water and then measured yield. It therefore cannot prove how much output would be preserved under a specific cut. Its contribution is diagnostic: measured applications were far above estimated need, and water productivity was low across the evaluated crops.
Better scheduling is the most immediate operational response. Irrigation timing and volume can be linked to crop growth stage, soil characteristics, local weather and measured evapotranspiration. The paper also discusses improved surface irrigation design, flow measurement and carefully controlled deficit irrigation.
Moving directly to pressurized irrigation could raise application efficiency, but that choice is not cost free. Pumps and pressure systems require capital and energy. For smaller producers, improving the design and scheduling of existing surface systems may be more realistic than replacing the entire network.
What the numbers mean for water allocation
A water authority that optimizes only kilograms per cubic metre could favour forage sorghum and watermelon. A policy that optimizes only gross value could favour cotton and walnut. Neither approach fully captures food production, farm income, employment, market risk, energy use or the long life of orchard investments.
The more defensible approach is to use both physical and economic measures, then add local constraints. Watermelon and melon look attractive in this study, but their markets can be volatile and they require suitable logistics. Walnut trees cannot be shifted between crops each season. Cotton prices and input costs can change the revenue ranking.
The economic indicator is based on gross crop prices, not full farm profit. It does not subtract seed, labour, energy, fertilizer, machinery, packing or marketing costs. The reported dollar values should therefore be read as gross value generated per cubic metre, not net profit.
What remains unproven
The study covers one irrigation module and one production setting. Results should not be treated as a national estimate for Mexico. Canal condition, soils, farm layout, climate, management and crop mix differ across districts.
Crop water requirement was estimated with a recognized method, while applied volumes were measured in the field. Even so, application efficiency does not directly measure every destination of the excess water. Some water may recharge soil or groundwater, while some may evaporate, run off or drain beyond the active root zone.
The analysis also compares crops with fundamentally different products and production cycles. A kilogram of walnut is not equivalent to a kilogram of forage. That is precisely why the physical and economic indicators must be interpreted together.
The practical next test
The next step is a controlled field program that changes scheduling and delivery while tracking yield, quality, farm cost, energy use and downstream water movement. It should test whether the measured excess can be reduced without shifting risk onto producers.
For decision makers, the study already provides a clear warning. Large water allocations do not guarantee productive use. Measuring flows at the plot, matching applications to crop demand and evaluating both output and value can reveal where scarce irrigation water is creating the least benefit.
Methodology: Agrilinkage reviewed the peer reviewed article and its field methods, recalculated 182 percent of requirement as about 82 percent excess application, and compared the reported mean physical and economic productivity values. The cover is an original conceptual illustration and does not depict a specific farm.




Comments