
Why U.S. Farm Profits Can Fall While Cash Income Rises

Updated: Oct 7
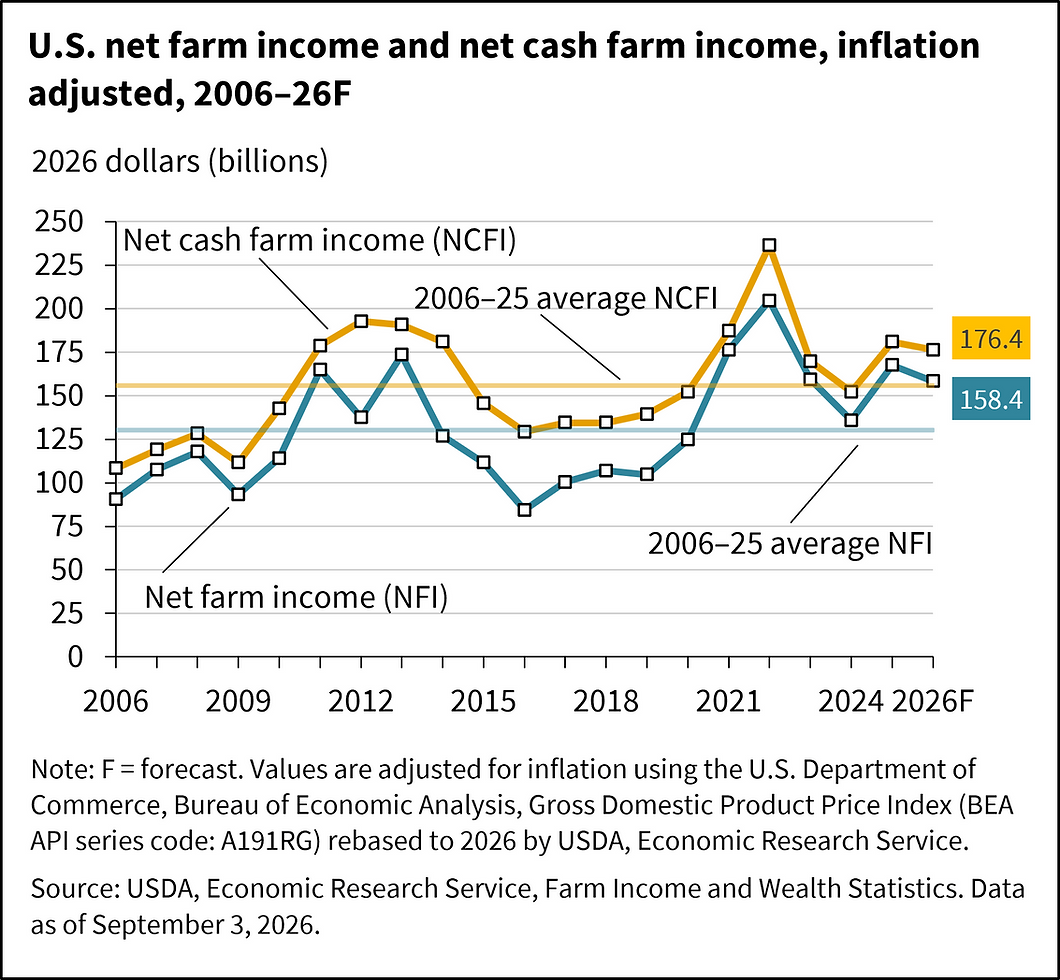
USDA's Economic Research Service forecasts U.S. net farm income at $158.4 billion in 2026, down $4.3 billion, or 2.6 percent, from 2025 in nominal terms. Net cash farm income is forecast at $176.4 billion, up $0.7 billion, or 0.4 percent. The figures can move in different directions because they measure different parts of the farm economy.
Net cash farm income tracks cash receipts from farming and farm related income, including government payments, minus cash expenses. Net farm income is a broader profit measure that also incorporates noncash items such as inventory changes, economic depreciation and imputed rental income for operator dwellings. A stronger cash position in one calendar year therefore does not necessarily mean the sector generated more economic profit.
Inflation makes the divergence more important. In 2026 dollars, ERS expects net farm income to fall 5.5 percent and net cash farm income to fall 2.5 percent. The small nominal increase in the cash measure disappears after adjusting for purchasing power, although both measures would remain above their 2006 to 2025 inflation adjusted averages if the forecast is realized.
Cash receipts also conceal sharply different commodity outcomes. Total farm cash receipts are forecast to decline 0.3 percent to $540.3 billion. Crop receipts are projected to rise 6.1 percent to $253 billion, supported by higher corn, soybean, cotton and vegetable and melon receipts, while animal and animal product receipts are expected to fall 5.4 percent to $287.3 billion.
Within livestock, the distribution is unusually uneven. ERS forecasts chicken egg receipts down 66.3 percent after a record 2025, milk receipts down 4.3 percent and hog receipts down 4 percent. Cattle and calf receipts are expected to increase 5.2 percent, showing why a national aggregate can mask very different financial conditions across farm types.
Government payments are a major support to the cash measure. Direct farm payments are forecast at $47.4 billion in 2026, up $19.5 billion, or 69.8 percent, from 2025. ERS attributes the increase mainly to commodity programmes linked to prices or revenue and to continued supplemental and ad hoc disaster assistance. These payments improve sector cash flow but do not remove the underlying pressure from expenses and weaker receipts in some categories.
Production expenses are forecast to rise 4.5 percent to $492.8 billion. Livestock and poultry purchases are projected to increase 11.4 percent, fertilizer, lime and soil conditioner spending 15.3 percent, and fuel and oil 28.8 percent. Feed spending is forecast to fall 2.1 percent and pesticide expenses 6.6 percent, but those savings are not enough to offset the larger increases elsewhere.
The useful reading is therefore not that U.S. farms are simultaneously becoming richer and poorer. The measures capture different accounting periods and components, while inflation, government support and commodity specialization redistribute the outcome. ERS updated the forecast on September 3 and plans its next release for December 2, so the current figures remain estimates that may change as prices, production, expenses and programme payments are revised.


Comments